The Burlington, Oakville and Hamilton real estate markets have continued to adjust in 2026, but the story is more complicated than simply saying home prices are rising or falling.
Through August, sales activity remained relatively subdued in several parts of the region, while prices generally remained below year-ago levels in the latest monthly data. At the same time, inventory has tightened in some markets, creating very different conditions depending on the city, neighbourhood and type of home.
For buyers and sellers, that means a broad headline about the Ontario housing market is not enough. Burlington, Oakville and Hamilton are neighbouring markets, but they are not moving in exactly the same way.
Here is what the latest available data tells us about the Burlington, Oakville and Hamilton real estate market in 2026, how current conditions compare with 2025, and what we believe buyers and sellers should be watching through the remainder of the year.
The 2026 Market at a Glance
The most recent complete monthly statistics are for August 2026.
According to Cornerstone Association of REALTORS®, activity across the broader Hamilton-Burlington-Haldimand-Niagara North market slowed considerably during August. Sales were down 14.5% from August 2025, while new listings declined 17.7%. The region’s MLS® Home Price Index benchmark was $728,400, down 3.9% year over year. Cornerstone Association of REALTORS®
The fact that listings declined alongside sales is important.
A slowdown in sales accompanied by rapidly increasing inventory can create substantially different conditions than a slowdown where sellers are also withdrawing from the market. Across the broader Cornerstone region, inventory was actually 11.3% lower than a year earlier in August, and months of supply stood at 4.4 months. Cornerstone Association of REALTORS®
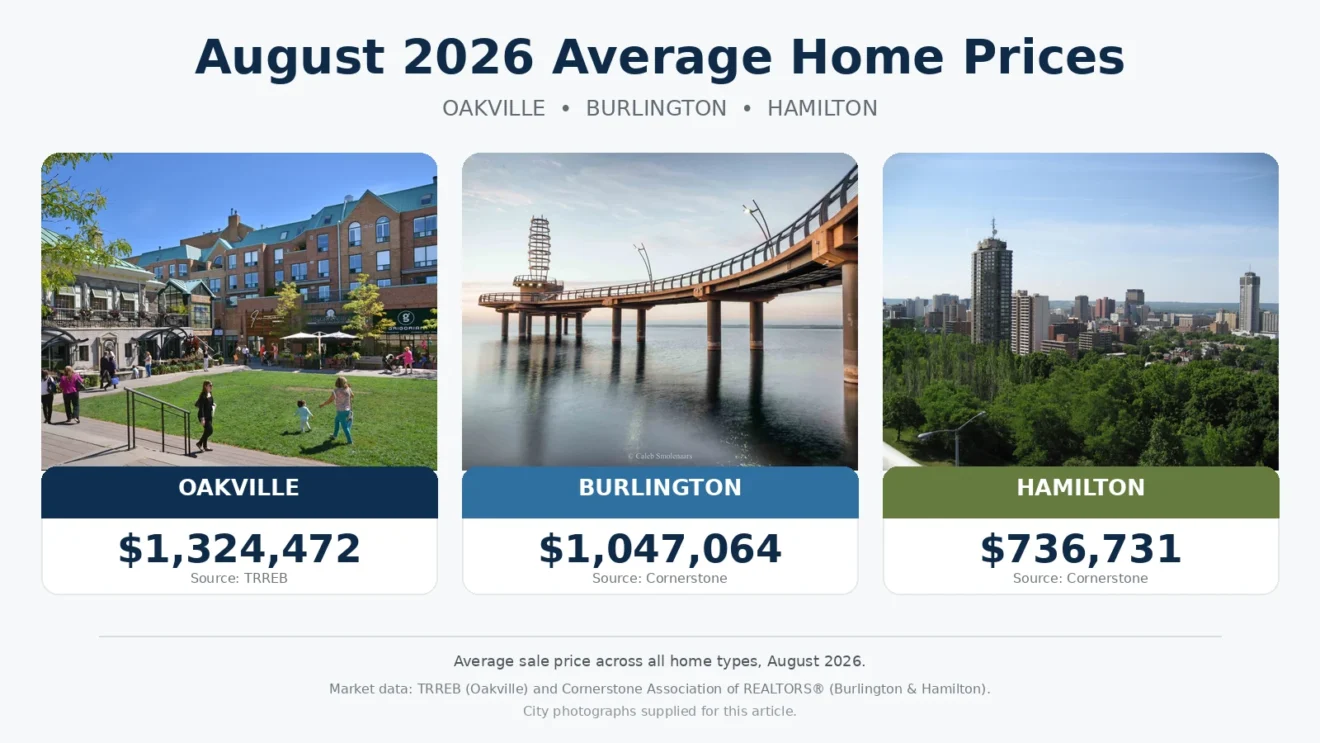
Oakville showed a similar tension between softer prices and reduced inventory. TRREB reported 203 Oakville sales in August at an average selling price of $1,324,472. Active listings were substantially lower than a year earlier even though the August average price also declined. HousingPortal.ca
In other words, 2026 has not produced a simple story of increasing supply and collapsing demand. Buyers remain selective, transaction volumes are relatively restrained, and pricing continues to depend heavily on location and property type.
Burlington Real Estate Market in 2026
Burlington entered the fall market with fewer sales, fewer new listings and lower average prices than a year earlier.
Cornerstone reported the following for August 2026:
| Burlington Market Metric | August 2026 | Year-over-Year Change |
|---|---|---|
| Average price | $1,047,064 | -7.0% |
| Home sales | 163 | -14.7% |
| New listings | 278 | -6.4% |
| Months of supply | 3.3 | -10.8% |
| Days on market | 41 | +5.1% |
Source: Cornerstone Association of REALTORS®, August 2026. Cornerstone Association of REALTORS®
The combination is noteworthy.
Prices and transaction volume were lower than last August, but Burlington did not experience a surge in available inventory. Months of supply actually declined year over year.
That suggests buyers have remained cautious, while sellers have also been relatively restrained about bringing properties to market.
Looking beyond a single month also provides useful context. Data compiled from the Cornerstone market reports puts Burlington’s average sale price for January through August 2026 at approximately $1.10 million, compared with approximately $1.13 million during the same period of 2025. Homes in Hamilton Ontario
That points to moderate year-to-date price softening rather than the more dramatic change someone might assume from looking only at an individual month’s average price.
It is also a reminder that monthly average prices can move noticeably depending on the mix of homes sold. A month containing fewer high-end detached sales, for example, can pull down the citywide average even if the market value of a particular comparable home has not declined by the same percentage.
For buyers interested in the city, Kiani & Co.’s current Burlington homes for sale page can provide a more useful look at what is actually available than relying only on citywide averages.
Oakville Real Estate Market in 2026
Oakville remains the highest-priced of the three markets covered in this report, but August brought softer pricing alongside significantly lower inventory.
TRREB’s August 2026 municipal figures show:
| Oakville Market Metric | August 2026 |
|---|---|
| Home sales | 203 |
| Average price | $1,324,472 |
| Median price | $1,200,000 |
| New listings | 421 |
| Active listings | 957 |
| Average days on market | 39 |
The average selling price was approximately 6.4% lower than August 2025, while sales were modestly lower year over year. More significantly, active inventory was roughly 23% below the previous August. HousingPortal.ca
Oakville therefore illustrates why sales numbers and prices should not be interpreted in isolation.
The city had fewer homes available for purchase than a year earlier, but that reduction in inventory did not translate into higher average prices during August.
The year-to-date picture is also different from the single-month result. Through August, available TRREB-based figures show an average Oakville sale price of approximately $1.447 million, about 1.2% above the corresponding 2025 period, with year-to-date sales also modestly higher. Saeed Anwar
That contrast is important.
August’s average price was down year over year, while the year-to-date average remained slightly higher.
Neither figure is wrong. They measure different periods, and the composition of homes sold can significantly affect average prices in a market such as Oakville, where property values span from condominium apartments to multimillion-dollar detached and waterfront homes.
Property type reinforces that point. In August, TRREB data showed average prices of approximately:
- $1.79 million for detached homes
- $1.05 million for townhomes
- $705,000 for condominium apartments Homebaba
A citywide number can therefore provide useful context, but buyers and sellers should ultimately compare similar homes in the same part of Oakville.
You can also view current Oakville homes for sale through Kiani & Co.
Hamilton Real Estate Market in 2026
Hamilton remains considerably more affordable on a citywide basis than Burlington and Oakville, but it has also experienced softer pricing and slower sales activity in 2026.
Cornerstone reported the following August figures:
| Hamilton Market Metric | August 2026 | Year-over-Year Change |
|---|---|---|
| Average price | $736,731 | -4.8% |
| Home sales | 382 | -19.4% |
| New listings | 845 | -18.9% |
| Months of supply | 4.5 | -4.3% |
| Days on market | 43 | +16.2% |
The largest movement here is transaction activity.
Hamilton sales were almost 20% lower than the previous August. However, new listings fell by a similarly large amount, preventing inventory from expanding substantially.
Year-to-date figures provide a clearer picture of the price trend. Hamilton’s average sale price through August 2026 was approximately $745,783, compared with $784,803 during the first eight months of 2025. Homes in Hamilton Ontario
That is a decrease of roughly 5%.
Hamilton also demonstrates why neighbourhood-level analysis matters.
Through August, year-to-date average prices reported within the broader city ranged considerably:
- Central Hamilton: approximately $501,743
- East Hamilton: approximately $532,410
- Hamilton Mountain: approximately $687,181
- West Hamilton: approximately $691,482
- Stoney Creek: approximately $765,944
- Dundas: approximately $912,644
- Waterdown: approximately $965,409
- Ancaster: approximately $1.074 million Homes in Hamilton Ontario
A statement such as “Hamilton homes average about $746,000” therefore tells only a small part of the story.
Someone purchasing in Central Hamilton is operating in a very different price environment from someone looking for a detached property in Ancaster.
Current listings can be viewed through Kiani & Co.’s Hamilton homes for sale page.
Burlington vs. Oakville vs. Hamilton in 2026
Looking at all three markets together illustrates how different the price environments remain.
Using the latest board-reported August figures:
| Market | August 2026 Average Price | General 2026 Picture |
|---|---|---|
| Burlington | $1,047,064 | Softer pricing with relatively constrained supply |
| Oakville | $1,324,472 | Highest average price, softer August pricing, reduced inventory |
| Hamilton | $736,731 | Lowest average price, weaker sales activity and softer pricing |
Sources: Cornerstone for Burlington and Hamilton; TRREB for Oakville. Cornerstone Association of REALTORS®
These figures should not be interpreted as showing that one city gained or lost exactly the difference between them. Different housing mixes, neighbourhoods and MLS datasets influence each average.
What they do demonstrate clearly is that buyers operating across the western GTA and Hamilton still encounter very different price points.
Someone comparing a detached home in Oakville with a condominium in Hamilton is not comparing equivalent products simply because both properties appear in a regional market report.
How Does 2026 Compare With 2025?
So far, the most defensible description of 2026 is a market with softer prices and restrained activity, but without a uniform build-up of inventory.
Hamilton provides a useful longer-term benchmark.
In 2025, Hamilton recorded 5,615 residential sales, the lowest annual total since 2010. The annual benchmark price was approximately $718,708, down 5% from 2024. Cornerstone Association of REALTORS®
The 2026 market has not suddenly returned to the intense conditions seen earlier in the decade.
Instead, several trends are occurring simultaneously:
- Buyers remain price conscious.
- Sales volumes are relatively subdued.
- Sellers have also pulled back in some markets.
- Homes are generally taking longer to sell.
- Average prices remain sensitive to the mix of properties sold.
- Conditions vary considerably by neighbourhood and property type.
That last point is particularly important.
A citywide annual or monthly percentage should not be applied directly to an individual property.
Cornerstone explicitly cautions that market statistics are useful for identifying broader trends but should not be used to conclude that a particular property increased or decreased in value by the same percentage. Cornerstone Association of REALTORS®
Interest Rates Have Been More Stable in 2026
One meaningful difference between earlier market conditions and 2026 has been interest-rate stability.
As of the Bank of Canada’s September 2, 2026 decision, the overnight policy rate remains 2.25%.
The Bank has held that rate at every scheduled announcement so far in 2026, following its final 2025 reduction in October. Bank of Canada
For buyers, a stable policy rate does not mean mortgage rates themselves cannot change. Fixed mortgage rates are influenced by factors beyond the overnight rate, and lenders set their own pricing.
For context, Bank of Canada data for September 23 listed the major banks’ conventional posted rates at:
- 5.49% for a one-year mortgage
- 6.05% for a three-year mortgage
- 6.09% for a five-year mortgage
These are posted rates rather than necessarily the discounted rates an individual borrower may receive. Bank of Canada
Financing therefore remains an important part of affordability even when the Bank of Canada’s policy rate is unchanged.
What Does the 2026 Market Mean for Buyers?
Current conditions may give buyers something that was difficult to find during more competitive periods: time to evaluate individual properties more carefully.
That does not mean every listing can be negotiated aggressively.
Well-priced homes in desirable neighbourhoods can still attract competition, while properties that are overpriced, require substantial work or face more competition from comparable listings may offer greater negotiating room.
For buyers, we believe the priorities should include:
- getting financing and a realistic budget established before searching seriously;
- comparing recent sales rather than relying on asking prices;
- evaluating the neighbourhood and property type separately from citywide averages;
- considering days on market and competing inventory;
- understanding why a property has remained unsold;
- and preserving appropriate conditions where circumstances warrant them.
Kiani & Co.’s approach to buying focuses on developing a strategy around the buyer’s needs while helping clients understand the Southern Ontario market and negotiate the terms of a purchase. Kiani & Co. Real Estate
What Does the 2026 Market Mean for Sellers?
The current market places greater importance on pricing accurately from the beginning.
When buyers have more time to compare listings, a property priced substantially above recent comparable sales can struggle to generate attention.
Sellers should look beyond the city’s average price and consider:
- recent sales of genuinely comparable properties;
- current competing listings;
- neighbourhood-level inventory;
- property condition and renovations;
- lot size and location;
- days on market for similar homes;
- the type of property being sold;
- and how current buyers are responding to the relevant price range.
For example, Burlington’s citywide average price declining 7% in August does not establish that every Burlington home is worth 7% less.
The correct comparison is between the subject home and recent relevant sales.
Kiani & Co. offers both a full-service selling program and a home evaluation service for homeowners who want to understand how their property fits into current conditions.
What Should We Watch Through the Rest of 2026?
Rather than trying to predict exactly where home prices will finish the year, there are several measurable factors worth monitoring.
Inventory
A continued decline in listings could change the negotiating balance even without a dramatic increase in buyers.
August already showed declining inventory across the broader Hamilton-Burlington region and in Oakville. Cornerstone Association of REALTORS®
Sales Activity
A sustained increase in transactions would provide stronger evidence of changing demand than one unusually active month.
Days on Market
Longer selling times can indicate that buyers are taking more time, although the figure should always be evaluated alongside inventory and sales.
Interest Rates
The Bank of Canada’s next scheduled policy-rate announcement is October 28, 2026, followed by another on December 9. Bank of Canada
There is no guarantee that the Bank will change rates at either meeting, so buyers and sellers should avoid making decisions based solely on an assumed future cut or increase.
Property Type
Detached homes, townhouses and condominiums can behave very differently even inside the same city.
That makes property-specific data increasingly important as broad market averages become less useful for answering questions about an individual home.
The Local Market Matters More Than the Headline
The biggest lesson from the Burlington, Oakville and Hamilton real estate market in 2026 is that there is no single market condition that applies equally to every buyer, seller or property.
Burlington has experienced softer prices while maintaining relatively constrained supply.
Oakville’s August average price declined even though active inventory fell significantly, while its year-to-date price remained slightly ahead of the corresponding 2025 period.
Hamilton has seen weaker sales and softer prices, but conditions vary substantially between areas such as Central Hamilton, the Mountain, Stoney Creek, Waterdown, Dundas and Ancaster.
For anyone planning a move, the useful question is therefore not simply:
“What is the market doing?”
It is:
“What is happening with homes like mine, or the type of home I want to buy, in the neighbourhood and price range that matter to me?”
That is where local comparable sales, current competition and property-specific analysis become much more valuable than a citywide average.
Frequently Asked Questions
Are home prices falling in Burlington in 2026?
Burlington’s August 2026 average sale price was $1,047,064, down 7% from August 2025 according to Cornerstone. The year-to-date decline has been more moderate, with the average through August approximately 3% lower than the corresponding 2025 period. Cornerstone Association of REALTORS®
What is the average home price in Oakville in 2026?
The average Oakville home sold for $1,324,472 in August 2026 according to TRREB data. The year-to-date average through August was approximately $1.447 million. Those figures differ because one represents a single month and the other represents transactions accumulated throughout the year. HousingPortal.ca
What is the average home price in Hamilton in 2026?
Hamilton’s average residential selling price was $736,731 in August 2026 according to Cornerstone. The January through August average was approximately $745,783. Cornerstone Association of REALTORS®
Is 2026 a buyer’s or seller’s market?
There is not one answer that accurately describes every neighbourhood and property type across Burlington, Oakville and Hamilton. Inventory, sales activity and property type vary considerably. Buyers and sellers should examine the relevant neighbourhood and comparable properties rather than relying on a regional label.
Will home prices rise later in 2026?
Current data cannot establish that with certainty. Interest rates, inventory, buyer demand, economic conditions and the mix of properties sold can all influence future pricing. Rather than assuming prices will rise or fall, we recommend watching those indicators and evaluating the market when a purchase or sale actually makes sense for your circumstances.
Thinking About Buying or Selling in Burlington, Oakville or Hamilton?
Market reports are useful for understanding the direction of the housing market, but they cannot tell you exactly what an individual property is worth or whether a particular home is a good fit for you.
At Kiani & Co., we help buyers and sellers understand the numbers that matter for their specific neighbourhood, property type and goals.
Whether you are considering selling your current home, moving to another community or simply trying to understand your options, connect with Kiani & Co. for a more personalized look at today’s market.
Market data current through August 2026. Last updated September 2026.